Bloodhound™ 2.0 Coming soon!
Bloodhound 2.0, the first and only commercial kinship analysis tool capable of operating with no human intervention. Whether you leave it entirely up to artificial intelligence or choose to have an analyst review and confirm the matches, Bloodhound 2.0 delivers unmatched precision and confidence assessments across the spectrum of pedigrees, no matter how much genetic information is available.

Thresholds and Decisions are Objective and quantified
The AI leverages the discrimination ability of pedigree structures and genotypes, the allele frequency distribution of the relevant population and a global analysis of all pedigree matches against the individuals in the database to deliver matches and their associated probabilities.


From simple pedigrees
A truly hands-off pedigree mapping engine.
To complex pedigrees
See complex multi-generation pedigrees, recognize similar pedigree structures and identify structure classes that cannot be solved.
To pedigree networks
Display individuals and pedigrees as an informative network map to better understand the AI’s decisions.
BLOODHOUND 2.0 anywhere
Bloodhound 2.0 was designed for mobility, whether records need to be reviewed in the lab, on the field or at home.

Be always in the know
On the field and new data was just delivered to the database? Bloodhound 2.0 allows you to connect no matter where you are and see the data.
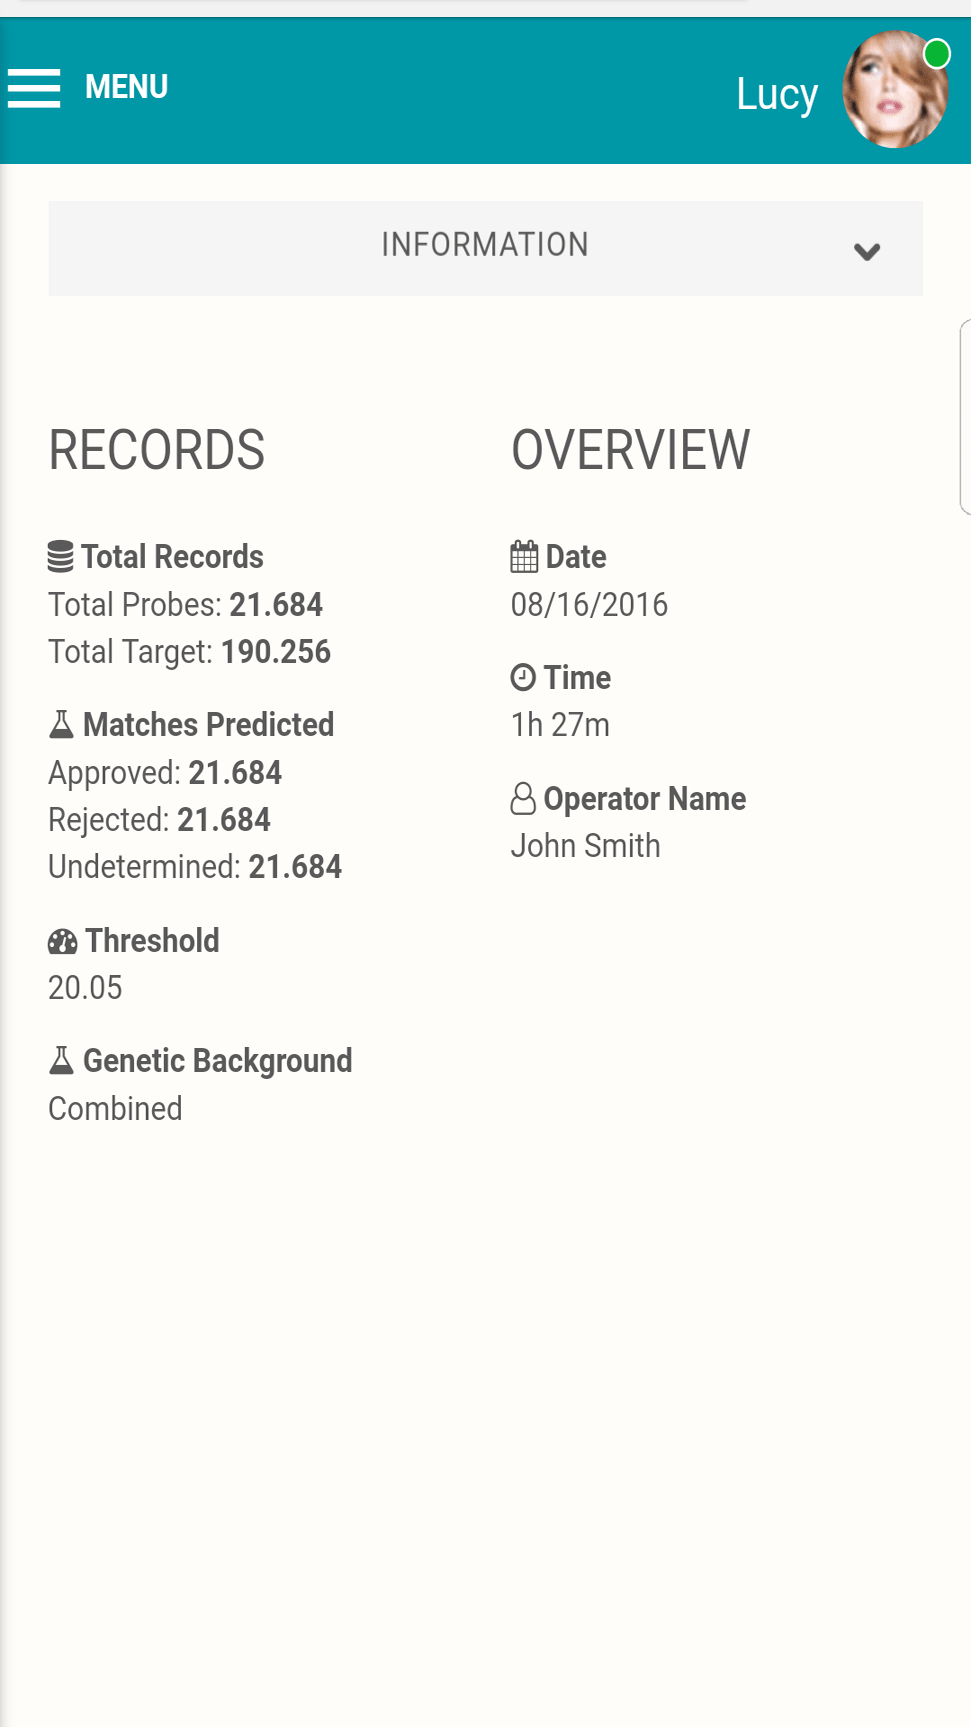
See what matters
Get the complete picture, even from your phone.
Make decisions when you need to
No need to wait until you are back in the lab to review and approve new matches.
BLOODHOUND Technical Features
Traceability and flexibility
Bloodhound 2.0 includes audit trail logging and a clustered relational database backend for high availability and scalability.
Platform versatility
Bloodhound 2.0 has been optimized to leverage today’s massively parallel computer architecture capabilities from general-purpose computing on graphics processing units, to multi-threaded/multicore processors on a local server cluster, to cloud services.
BLOODHOUND 2.0 performance
Process billions of comparisons in mere minutes and iteratively solve complex and degenerate pedigrees that were previously unsolvable.
Load, Score & Rank, Characterize and Optimize
The Bloodhound AI engine can be trained and tuned to deliver results
Although the AI is able to continuously move across iterations, the interface was designed to gate the AI's resulting matches for review by a human analyst.

All the details you need To Make The Right Match
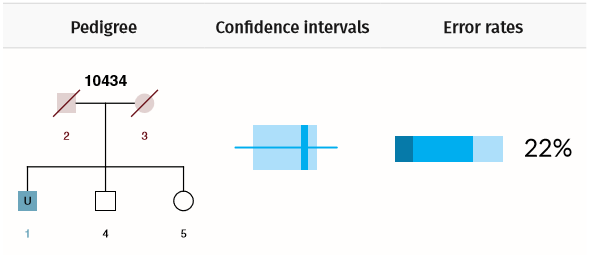
Score and rank
Compare LR scores for possible matches and their rank


Confidence interval
See how true matches and random matches line up in the target pedigree

Error rates
Know your odds of making an incorrect match
Complex Pedigrees And Network Mapping Engine
Complex relationships
Whatever the structure, the pedigree mapping engine will detect it and display it.

Multi-generations and multi missing nodes
The AI's scoring and mapping capability outshines all other methods on complex pedigrees.

Network of related pedigrees
When too little genetic information is available to solve the kinship structure, the network mapping engine can display the individual in a network of related pedigrees.
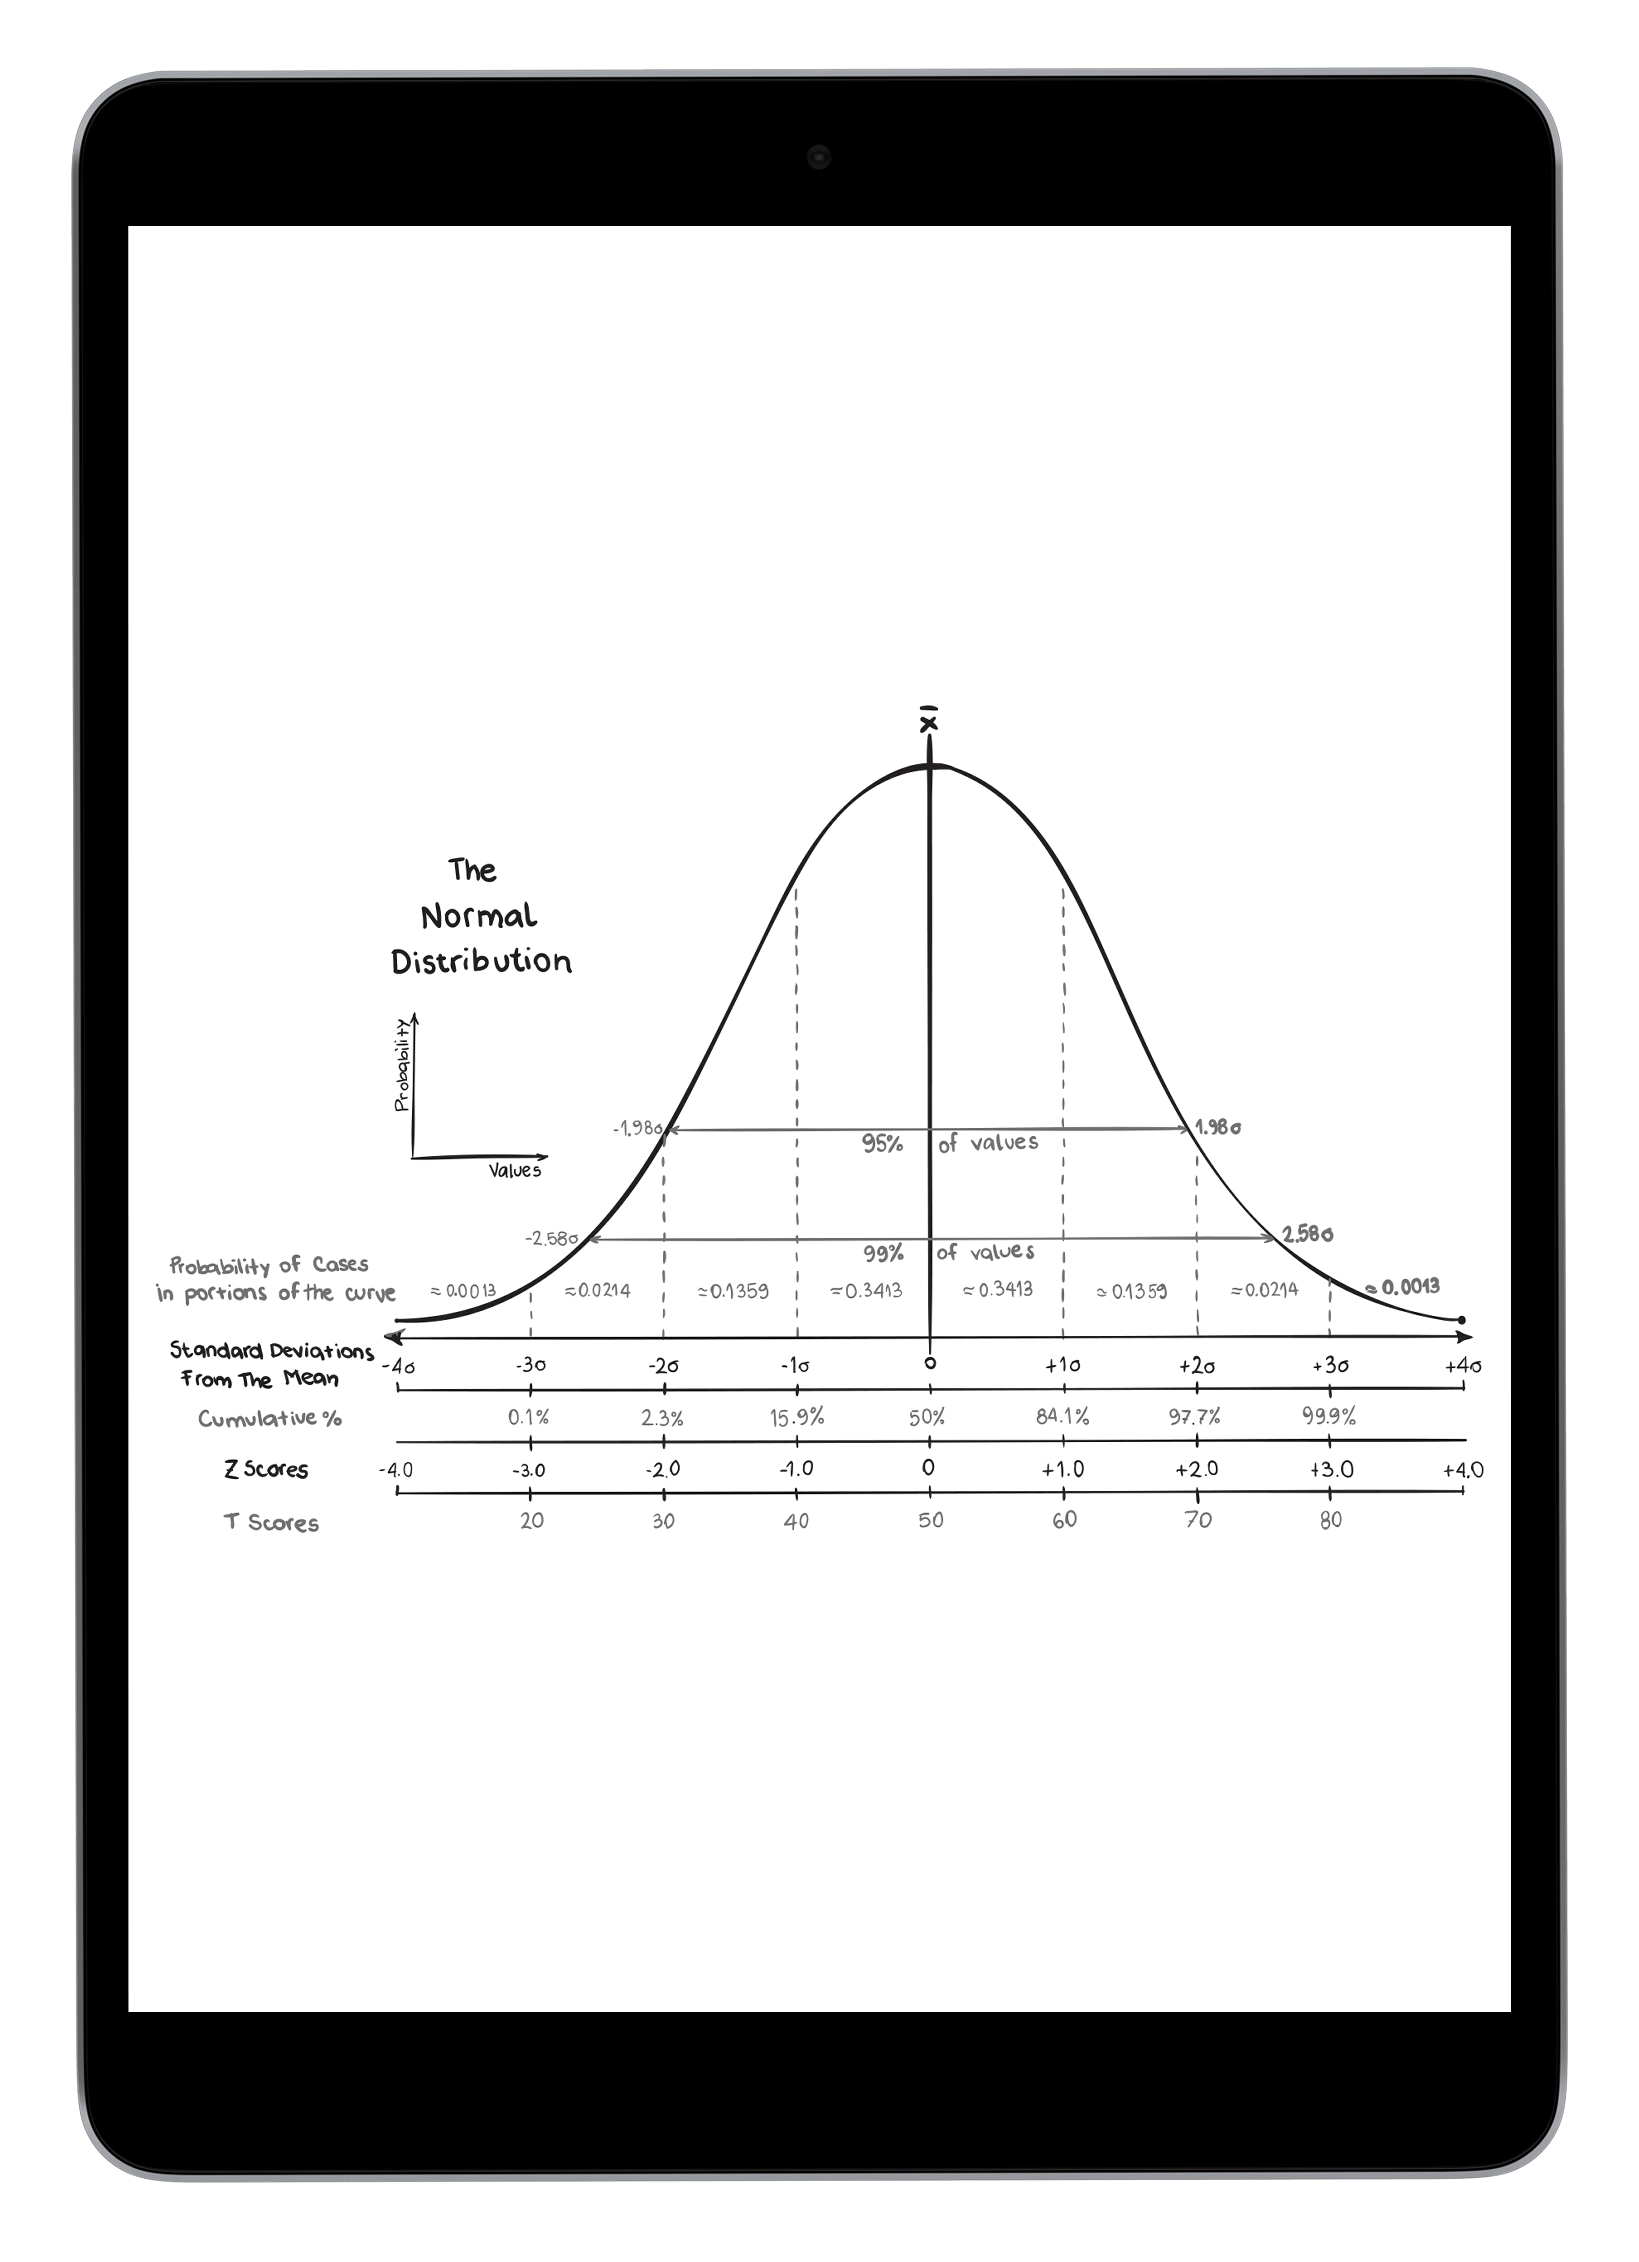
Understanding confidence intervals
Why are they important to forensic kinship analysis?
Understanding impact of allele variability
And pedigree structures on matching performance
Let’s imagine a simple pedigree structure with 2 genotyped parents and a missing child.
Other pedigrees with the same structure and different starting alleles, yield very different confidence intervals…
And different error rates

And whatever the structure, Bloodhound can obtain and a clear picture of how the scores spread…

And the probability of observing a true match

Getting the best answer you can get
Bloodhound uses an artificial intelligence powered engine and network analysis for match optimization. A recently performed large scale study of over 10,000 simulated pedigrees and missing individuals demonstrated the Bloodhound classifier outperformed a classifier that relied on LR score rankings alone by an average 17%.
What’s new in Bloodhound
The latest Bloodhound delivers unmatched precision, performance and flexibility to forensic kinship analysis.
Objective and quantified
Introducing performance quantitation to forensics.
Let the Bloodhound AI show you the impact of different allele combinations or permutations in pedigree structures on your ability to find the correct match.
Fully automated
Let the Bloodhound AI show you the impact of different allele combinations or permutations in pedigree structures on your ability to find the correct match.

Network analysis
First use of AI and network analysis in forensics. Input pedigrees are quickly organized into higher order structures with similar solution characteristics for faster results.


Learn and solve
Iterative resolution of structures with multiple missing individuals.
With each new pedigree Bloodhound learns something new and processes new data a little faster.

Access anywhere
Mobile access. Connect to Bloodhound from your favorite device, whenever you need to and wherever you are.
Platform versatility
Performance optimization across multiple technology platforms
Whatever the resources at hand, Bloodhound has been designed to make the best of it and process the data efficiently.

How Bloodhound functions
Example scenarios for demonstrating individual-pedigree matching performance by an artificial intelligence
In this document, we introduce an artificial intelligence (AI) tool that can match missing individuals to families (pedigrees) with calculated probabilities.
Example scenarios for demonstrating individual-pedigree matching performance by an Artificial Intelligence
In this document, we introduce an artificial intelligence (AI) tool that can match missing individuals to families (pedigrees) with calculated probabilities. We have developed a method to score potential relationships (likelihood ratio scores) that the AI can understand and exploit to find matches for a target pedigree within a searchable database of genotyped individuals. To demonstrate how the AI can assist in solving kinship analysis problems, we present a series of example scenarios.
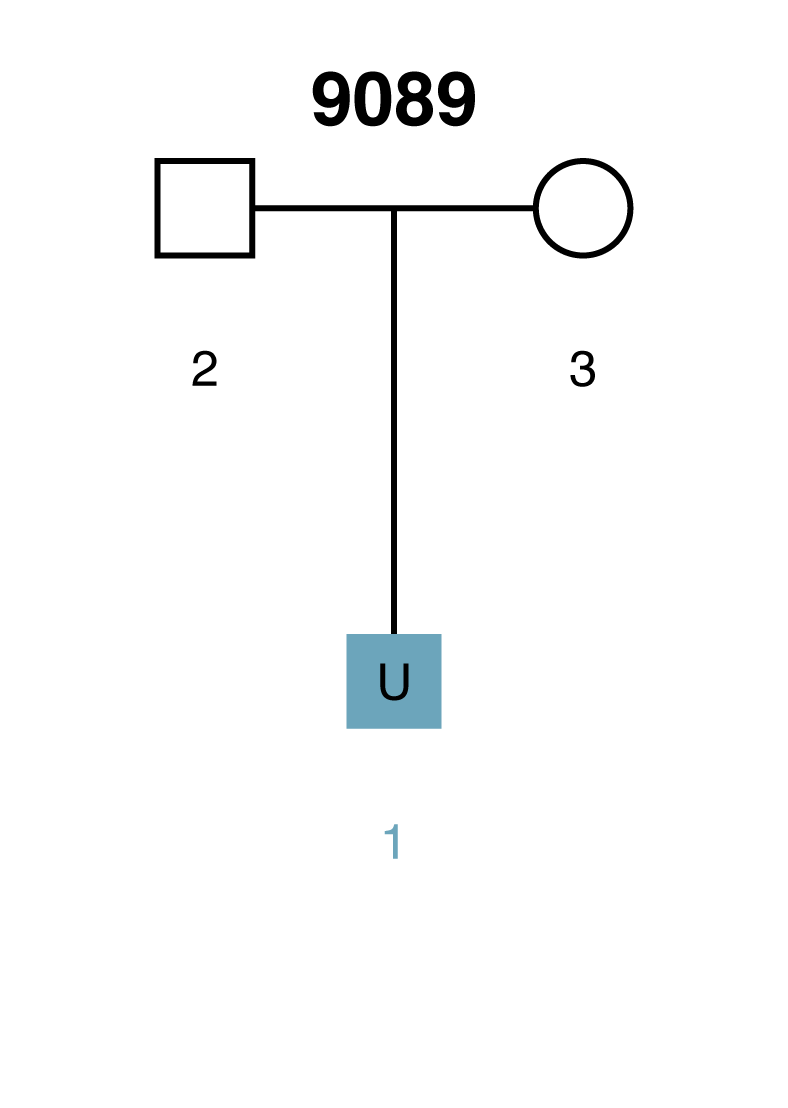
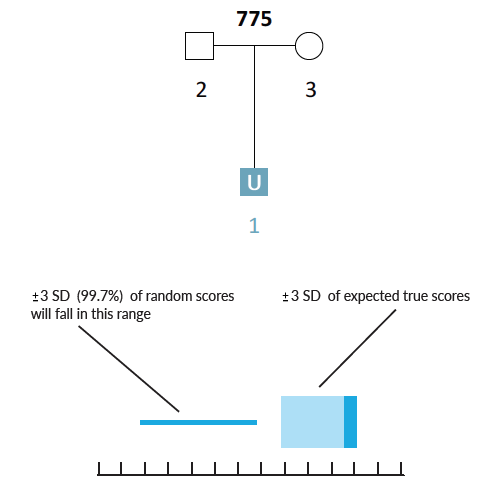
Scenario 1: Missing person is a child
Here is a simple scenario in which there are genotyped parents but the child is unknown (U1). If the AI were presented with the missing child's genotype, then it would have a complete parentage trio. However, when searching through thousands of unrelated individuals the AI will occasionally encounter individuals that have genotypes similar to the missing child (U1) by chance alone. Given the parental genotypes, we can query the AI for the range of likelihood ratio (LR) scores that we expect the true missing child to fall within. We can also query for the range of LR scores that we expect false matches to fall within.
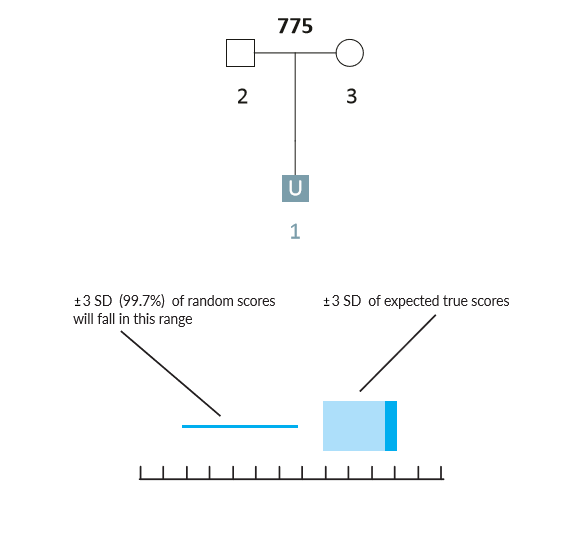
Example Scenario 1A. For a missing child with both parents genotyped, expected likelihood ratio scores for false (random) matches don't overlap with expected scores for true matches. In this scenario, if the missing child's genotype exists in a searchable database, the AI will identify it as a match.
In Scenario 1A, the thin horizontal line on the left represents the scores our AI expects to observe from unrelated matches, and the wide horizontal band on the right represents the scores that the AI expects for a true child of those parents. These ranges represent three-sigma confidence intervals for LR scores (a conventional heuristic that "nearly all" values are expected to lie within this interval). The dark blue shading on the true match confidence interval represents the range of scores expected for a best-case scenario (in which the child scored at the top range of expected true matches). In this example, the AI calculates zero probability of confidence interval overlap between expected false and expected true matches.
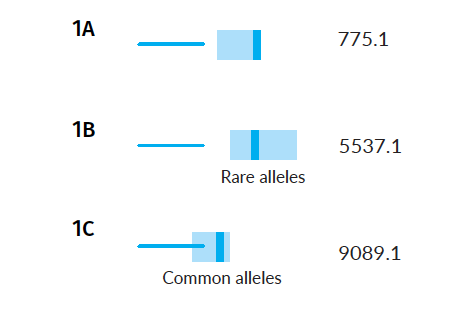
As a complicating factor, consider that other parents may also have a missing child. How does the presence of other pedigrees with missing children affect the calculation of confidence intervals in this example scenario?
The range for false matches remains the same (its calculation represents an aggregate of all random match scores), but the true match scores depend on the starting alleles (gene variants) of the parents. If the parents have especially rare alleles, we would expect the range of true scores to be high because the missing child is unlikely to match well against other sets of parents. Conversely, if the parents have especially common alleles, we would expect the range of true scores to be low.
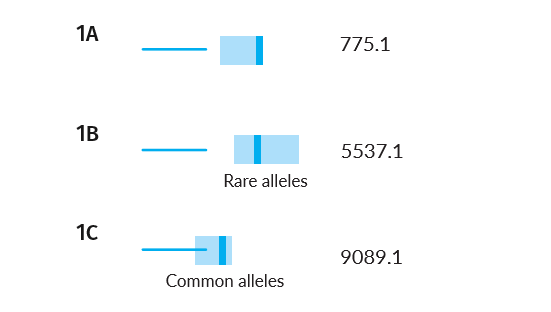
Example Scenarios 1A, 1B and 1C. Parentage trios with missing children where parental alleles have varying frequency in the population.
The AI understands, based on evaluating the alleles in each family, that the confidence intervals will vary, and will subsequently search for matches in those different score ranges. Notice that in the case of rare parental alleles (Scenario 1B), the confidence intervals of expected false and true matches don't overlap, but when the parents have common alleles (Scenario 1C) they do.
Scenario 2: Missing person is a parent
Here we present a weaker scenario: a parent is the unknown (U2), there is no genotype data for the spouse (3), but the child (1) is genotyped. To make things even more difficult, the only confirmed individual in the pedigree (the child) has common alleles in the population under investigation.
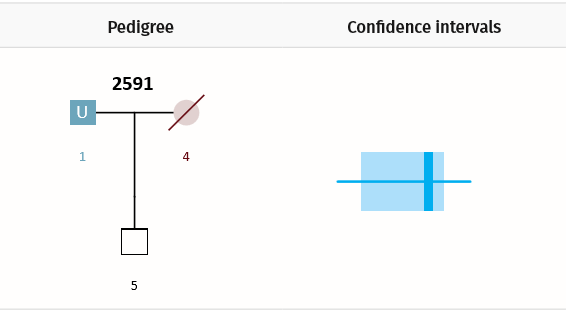
Example Scenario 2. For a missing parent with only a child genotyped, confidence intervals for false (random) matches and true matches overlap.
In Scenario 2, the confidence interval for true matches strongly overlaps the confidence interval for unrelated matches. As a result, the AI will lower its filtering thresholds accordingly, potentially returning us a greater proportion of false positive matches. In a given dataset, for every missing person in every pedigree, the AI calculates what to expect in each error class: true positives (TP), false negatives (FN), and false positives (FP).
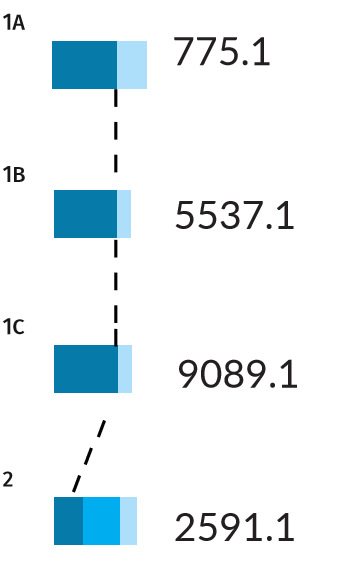
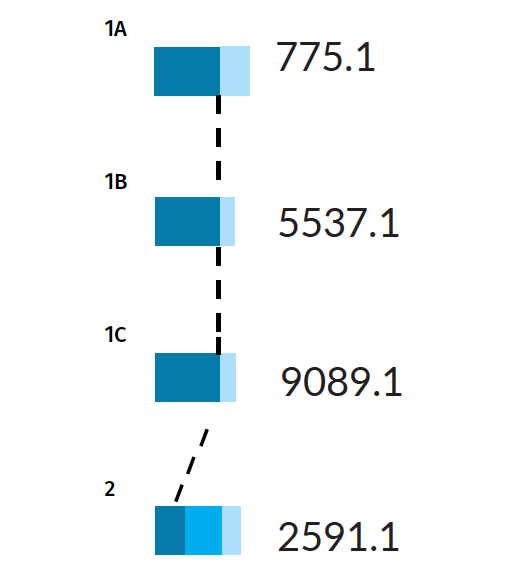
Error rates for Scenarios 1A, 1B, 1C, and 2. Dark blue bars indicate the true positive rate PTP , while the light blue bars indicate the false positive rate PFP . Scenario 2, being more difficult, also has a false negative rate PFN shown by the middle blue bar, indicating there is a chance for the wrong individual to be identified as a positive match.
The three pedigrees with a full parentage trio (Scenarios 1A, 1B, 1C) have a thick PTP bar (a true positive rate of 100%). This result means that if the missing person is present in the tested population, the AI is certain to find them. Nevertheless, the AI may also pull out some false positives for these scenarios, with probabilities ranging from 25-45%. The identification of false matches is unavoidable in a large population, as some individuals will resemble the missing target by chance alone.
In Scenario 2, the PTP bar is narrower (only 38%). In this case, there is a high chance that the true match will be misidentified as a non-match, giving a PFN of 62%. In other words, the AI is not guaranteed to find the correct match, even if the missing person is present among the genotyped members of a population.
Scenario 3: Missing person is a sibling
Example Scenario 3. For a missing child (U1) where neither parent is genotyped, but siblings are, the confidence interval for false (random) matches overlaps with the confidence interval for true matches. There is also a low true positive rate (PTP = 22%) and a high chance of identifying an incorrect match (PFN = 78%).
In Scenario 3 there is a greater overlap in the confidence intervals and only a 22% chance of identifying the correct match. If there were only one sibling, then matching performance would be even worse.
Every combination of pedigree structures, when mapped against the combination of alleles observed in the pedigree's genotyped individuals, generates a slightly different statistical power to detect true matches. If the AI has seen a certain pedigree structure before, then it will calculate error rates for a large number of potential allele combinations. For example, the AI has a roughly 1 in 5 chances of identifying the true match in Scenario 3, but if the missing person's siblings have especially rare alleles, the chance would be higher.
Variation in pedigree structure
Just as the AI can be trained to consider different allele combinations, it can also be trained to consider permutations in the pedigree structure. For example, how would the error rates in Scenario 3 differ if two more siblings were added to the pedigree, or if one of the parents was genotyped?
To effectively consider variation in pedigree structure, the AI organizes input pedigrees into higher order structures (i.e. families of pedigrees). For example, all pedigrees that have two genotyped parents and one missing child are understood to have similar solution characteristics. Pedigrees in which the missing person is a parent with one genotyped child belong to another class distinguished by the AI; pedigrees in which the missing person has two siblings belongs in yet another class; and so on.
Furthermore, the AI can process how similar the different classes of pedigree structure are to one another. When it is exposed to a new pedigree with a similar structure to one it has encountered before, it can quickly sort that pedigree into the correct structure class and thus calculate initial estimates for statistical power (error rates). The greater the variety of pedigree structures that the AI is exposed to, the faster it can process new data.
The ability to recognize similarities in pedigree structure provides an additional advantage: the identification of structure classes that cannot be solved regardless of genotypic information or population allele frequencies (see below).
Consanguineous scenarios and visualizing related pedigrees
In addition to the scenarios presented above, we have also developed a pedigree mapping engine (and corresponding naming convention) that can detect consanguineous relationships.
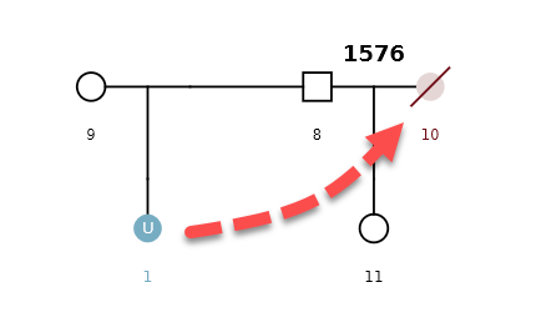
Example Scenario 4. The missing daughter (U1) of parents 8 and 9 is also correctly mapped as the missing mother of the second daughter (11).
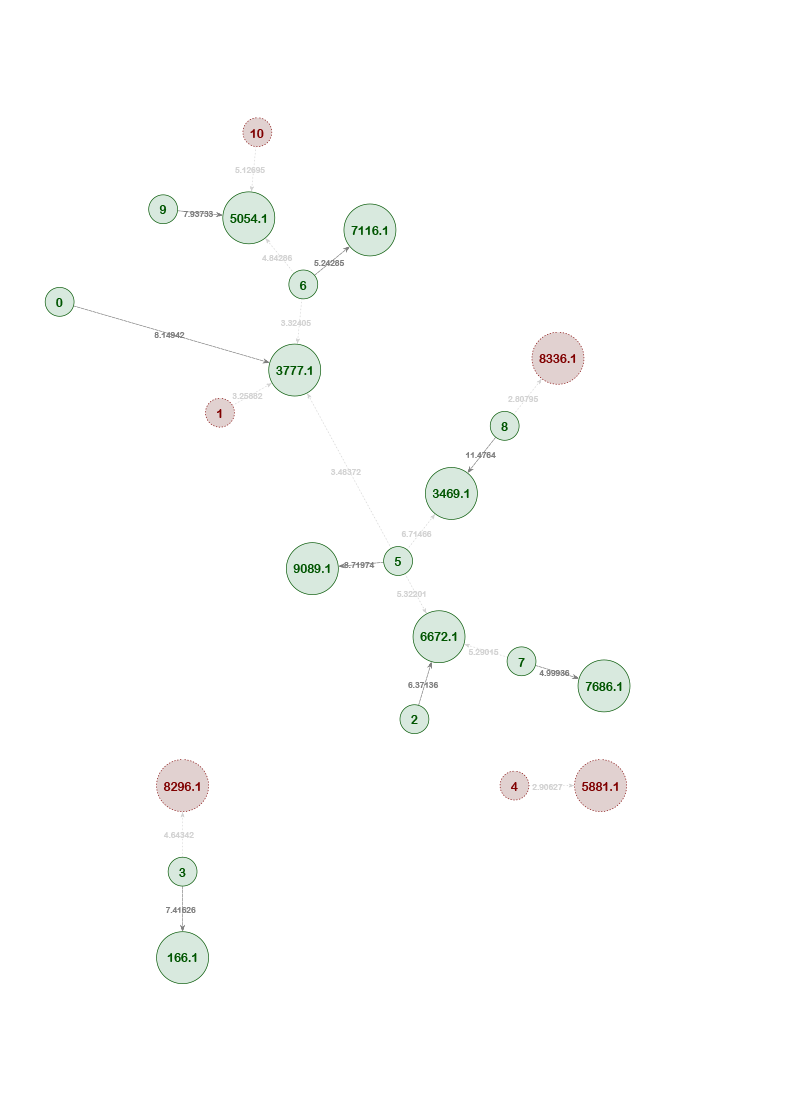
By detecting how different pedigrees in a dataset may be connected to each other through missing individuals, the AI can display individuals and pedigrees as an informative network map. Organizing pedigrees and individuals based on their "connectedness" allows them to be intuitively visualized and provides context to the AI's decisions.
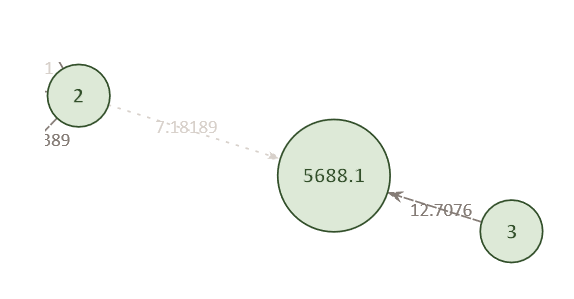
Within the network map, individuals are displayed as small circles with a corresponding single digit ID. The position of a missing member within a potentially matching pedigree is displayed as a large circle. The identifier represents the pedigree ID (four digits) and pedigree position of the missing member (decimal place). LR scores for potential matches are noted on the edges between individuals and pedigree positions.
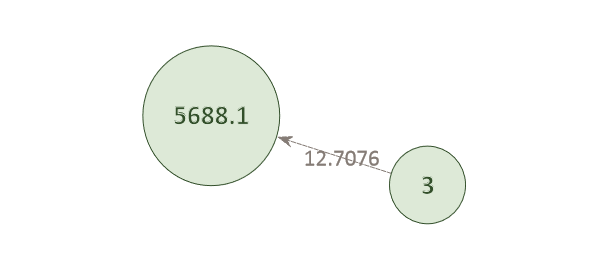
Example Network 1. The AI has matched individual 3 to the child position (xxxx.1) in pedigree 5688. The green color of the circles indicates that the probe-target association is likely correct. This individual does not match against any other pedigree in the system and its LR score (12.71) is high.
Conversely, a given pedigree position may have several potentially matching individuals.
Example Network 2. Individual 2 was also found to match against pedigree position 5688.1, albeit with a lower score (7.18) than Individual 3. The highest score for any given individual is indicated by a darker edge, while lower scoring connections have lighter edges.
The AI improves its matching and connecting ability as new data are provided. We train the AI on multiple sets of trials, where with each additional trial the AI is given a new set of allele combinations from which to reconstruct the pedigrees.
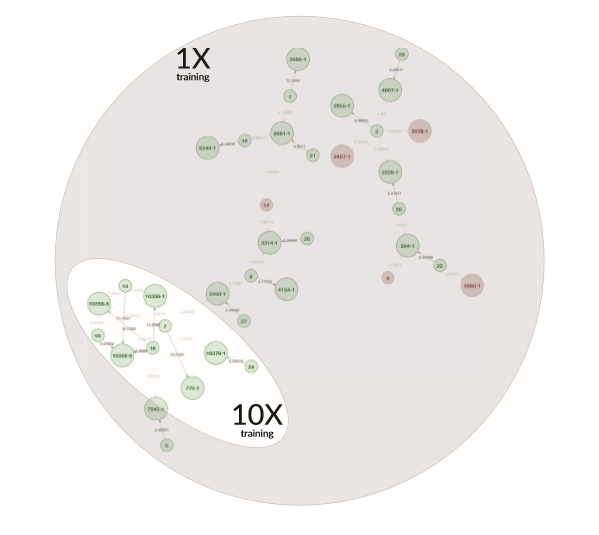
Example Network 3. The network map from an initial training set (as shown in the grey area) includes some red circles, which indicate that the AI has classified these individual-pedigree associations as incorrect with high probability. With each subsequent trial, the AI learns which associations are unlikely and eliminates individuals and pedigrees that are irrelevant to the network. The highlighted portion of the map is the network outcome after training the AI ten times.
Occasionally, the same individual may be matched to multiple pedigree positions with equally high probability. Such cases indicate unresolvable networks, where the available genetic information (e.g. especially common alleles and/or too many individuals in a pedigree with no genotype data) is simply insufficient to solve the kinship scenario.
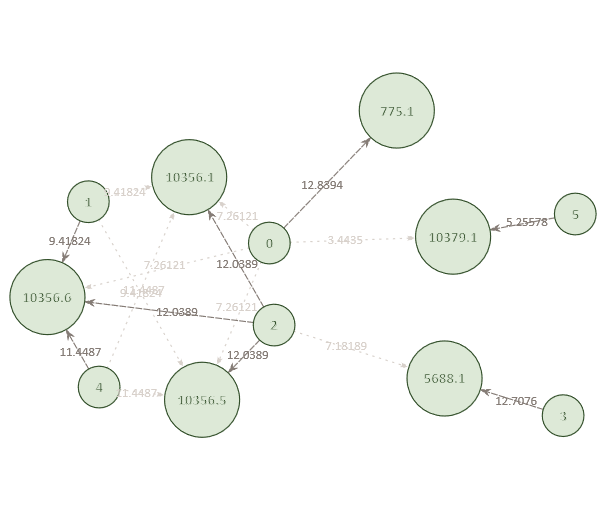
Example Network 4. The optimized network reveals that Individual 2 is also a potential match to multiple missing sibling positions in pedigree 10356. The remaining connections in the network include all individuals and pedigrees that are connected with a reasonable level of significance.
Once the networks have been optimally resolved after multiple training passes, the AI is usually able to identify correct individualpedigree matches even if they don't have the highest likelihood ratio score. In some cases, the highest score does not necessarily correspond to the correct match due to a high false positive rate (see above). Through network analysis, the AI can identify the correct match by logically eliminating incorrect matches that may nevertheless have higher scores.
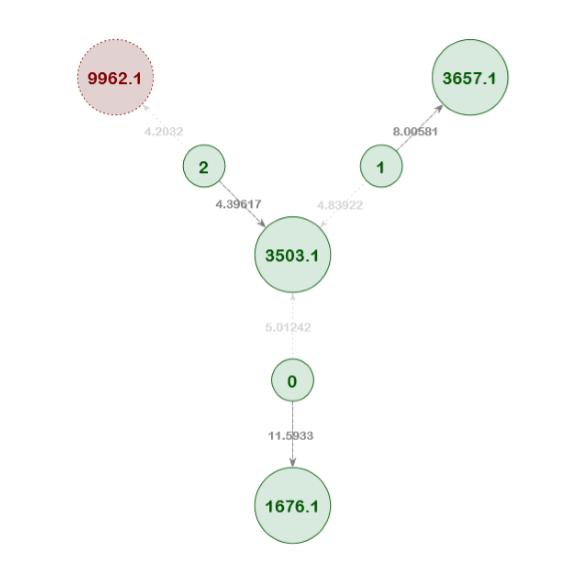
Example Network 5. In this resolved network, the pedigree position 3503.1 has three match candidates (individuals 0, 1, and 2). Individual 2 has the lowest score of the three, but it was still correctly identified as the best match. The network analysis logically eliminated the other two candidates from consideration because they were correctly matched to other pedigrees in the network. Furthermore, the other candidate pedigree match for Individual 2 (9962.1) was removed from the network over the course of the training passes.
Understanding complex pedigrees
The strength of the AI, in terms of both its scoring and mapping capability, is best highlighted with a complex pedigree scenario.
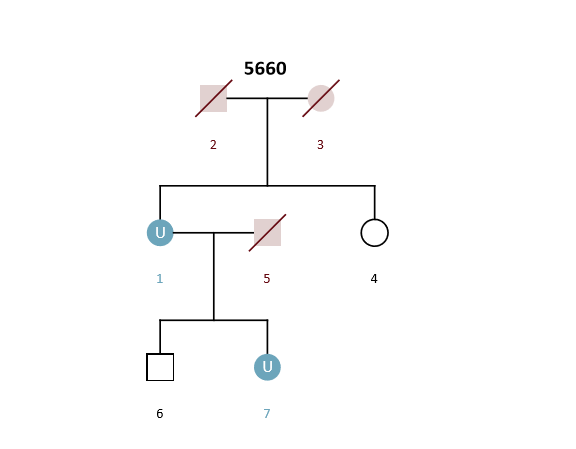
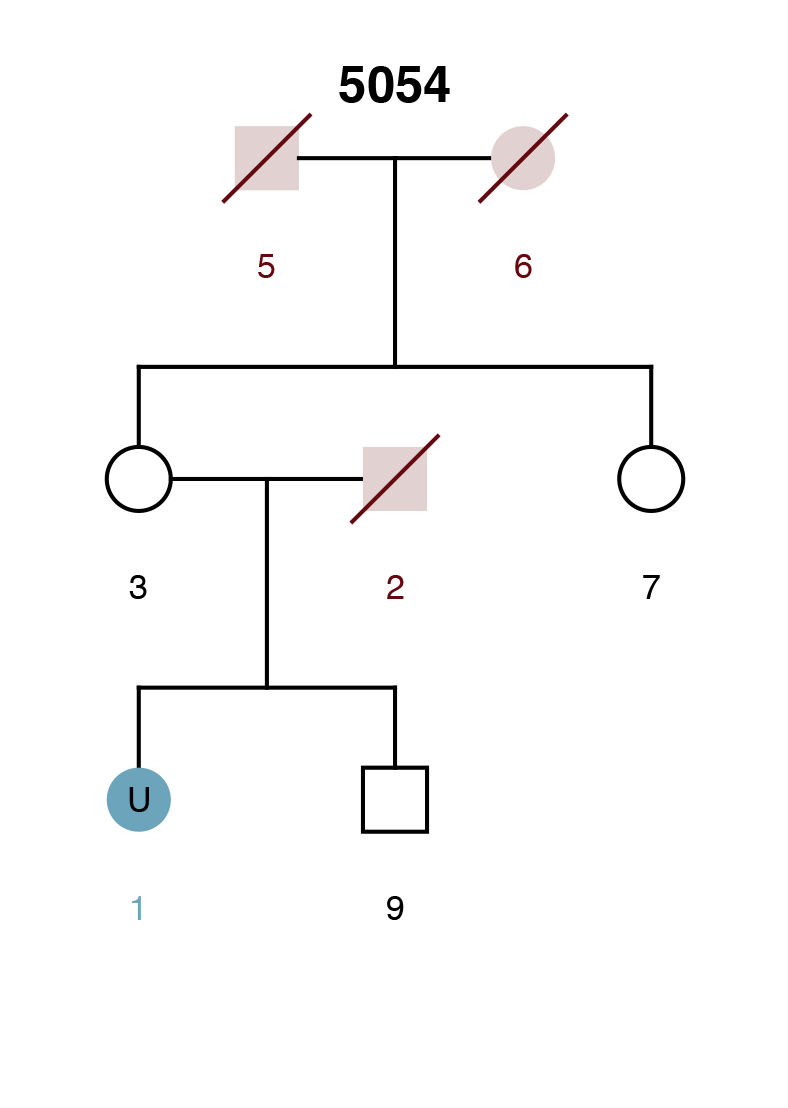
Example Scenario 5. For an unknown mother (U1) and daughter (U7) where only the genotypes of a sister (4) and son (6) are available.
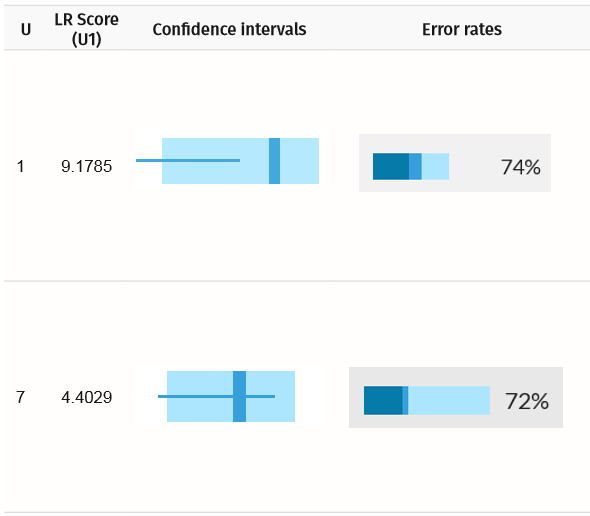
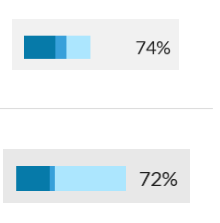
Confidence intervals and error rates for unknown mother (U1) and daughter (U7). The confidence intervals inform us that the alleles for the expected true matches overlap with random alleles.
For the daughter, despite a high LR score, the AI is about three times more likely to find a false positive than a true positive. As such, selecting correct matches solely on the basis of an arbitrarily set LR score threshold can be misleading.
Pedigrees with multiple missing members will have some matches that are easier to resolve than others. Resolving the more difficult matches becomes possible once easier matches are validated and included in the pedigree-genotype database. For example, while searching for the mother in Scenario 5, the AI will be looking for a match against the genotypes of her sister and son (both of which are first degree relationships). For the mother, the outcome is a strong match with a high degree of confidence.
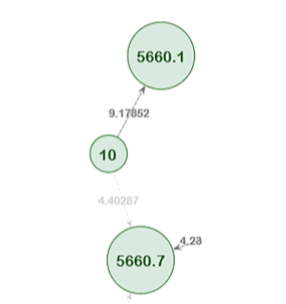
Network map for Scenario 5. According to the network map, the potential match for the mother (Individual 10) scores well in the daughter position (5660.7) also, which is to be expected given the direct relationship of both missing individuals to the son. Nevertheless, the confidence intervals clearly rule out the daughter position for Individual 10.
In searching for the daughter, the AI will be looking for a match against the genotypes of her brother and aunt, but the daughter will only score well against her brother. In this case, the AI is unable to locate a match for the daughter because the available information is insufficient to make a reasonable match. Simply lowering the LR threshold will increase the false positive rate. Nevertheless, the AI's learning ability does offer a new opportunity to find a match for the daughter. Once the correct match for the mother has been validated, inserting the mother's genotype into the pedigree could yield a successful search for the missing daughter. With the genotypes of both the mother and brother now available, we can expect a match to be identified with greater confidence.
Generally, confidence intervals for difficult matches improve with successive iterations as the AI takes newly matched individuals into account. This process also eliminates false positive matches for the difficult positions (that may have had higher scores in earlier iterations).
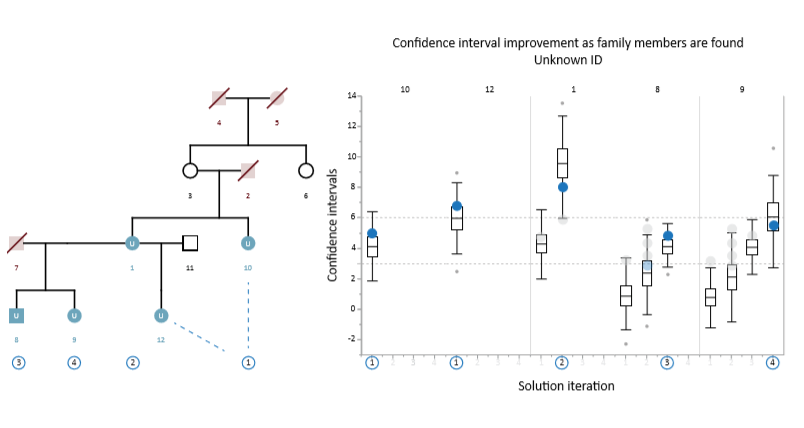
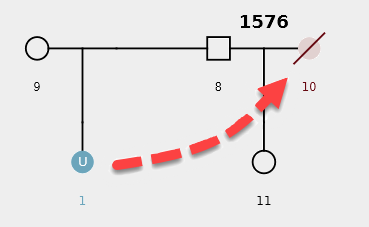
Example Scenario 6. For a complex pedigree with multiple missing members and individuals with no genotype data, full resolution is still possible through iterative analysis. In this case, positions 10 and 12 are resolved in the first iteration with high LR scores (correct match indicated by blue circles), but the other positions have low confidence interval ranges and the candidate with the highest LR score is a false positive (grey circles). In the 2nd iteration, the matches to positions 10 and 12 are used to recalculate the confidence intervals for the remaining positions, resulting in a successful match for position 1 (which now has a higher confidence interval). The inclusion of the correctly matched individual at position 1 then allows for a successful match at position 8 in the 3rd iteration; and finally position 9 is likewise resolved in the 4th iteration.
Scenario 1 Extended: Working with the AI interface
Although the AI is able to continuously move across iterations, the interface was designed to gate the AI's resulting matches for review by a human analyst.
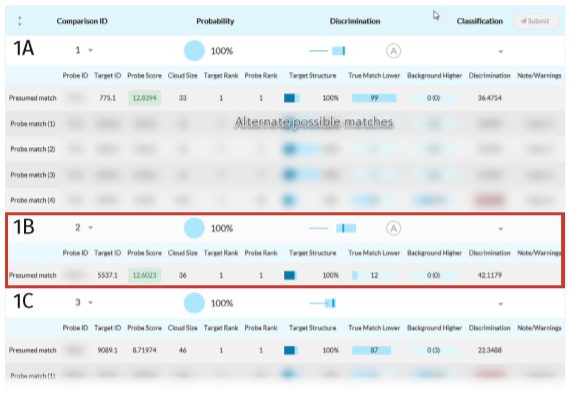
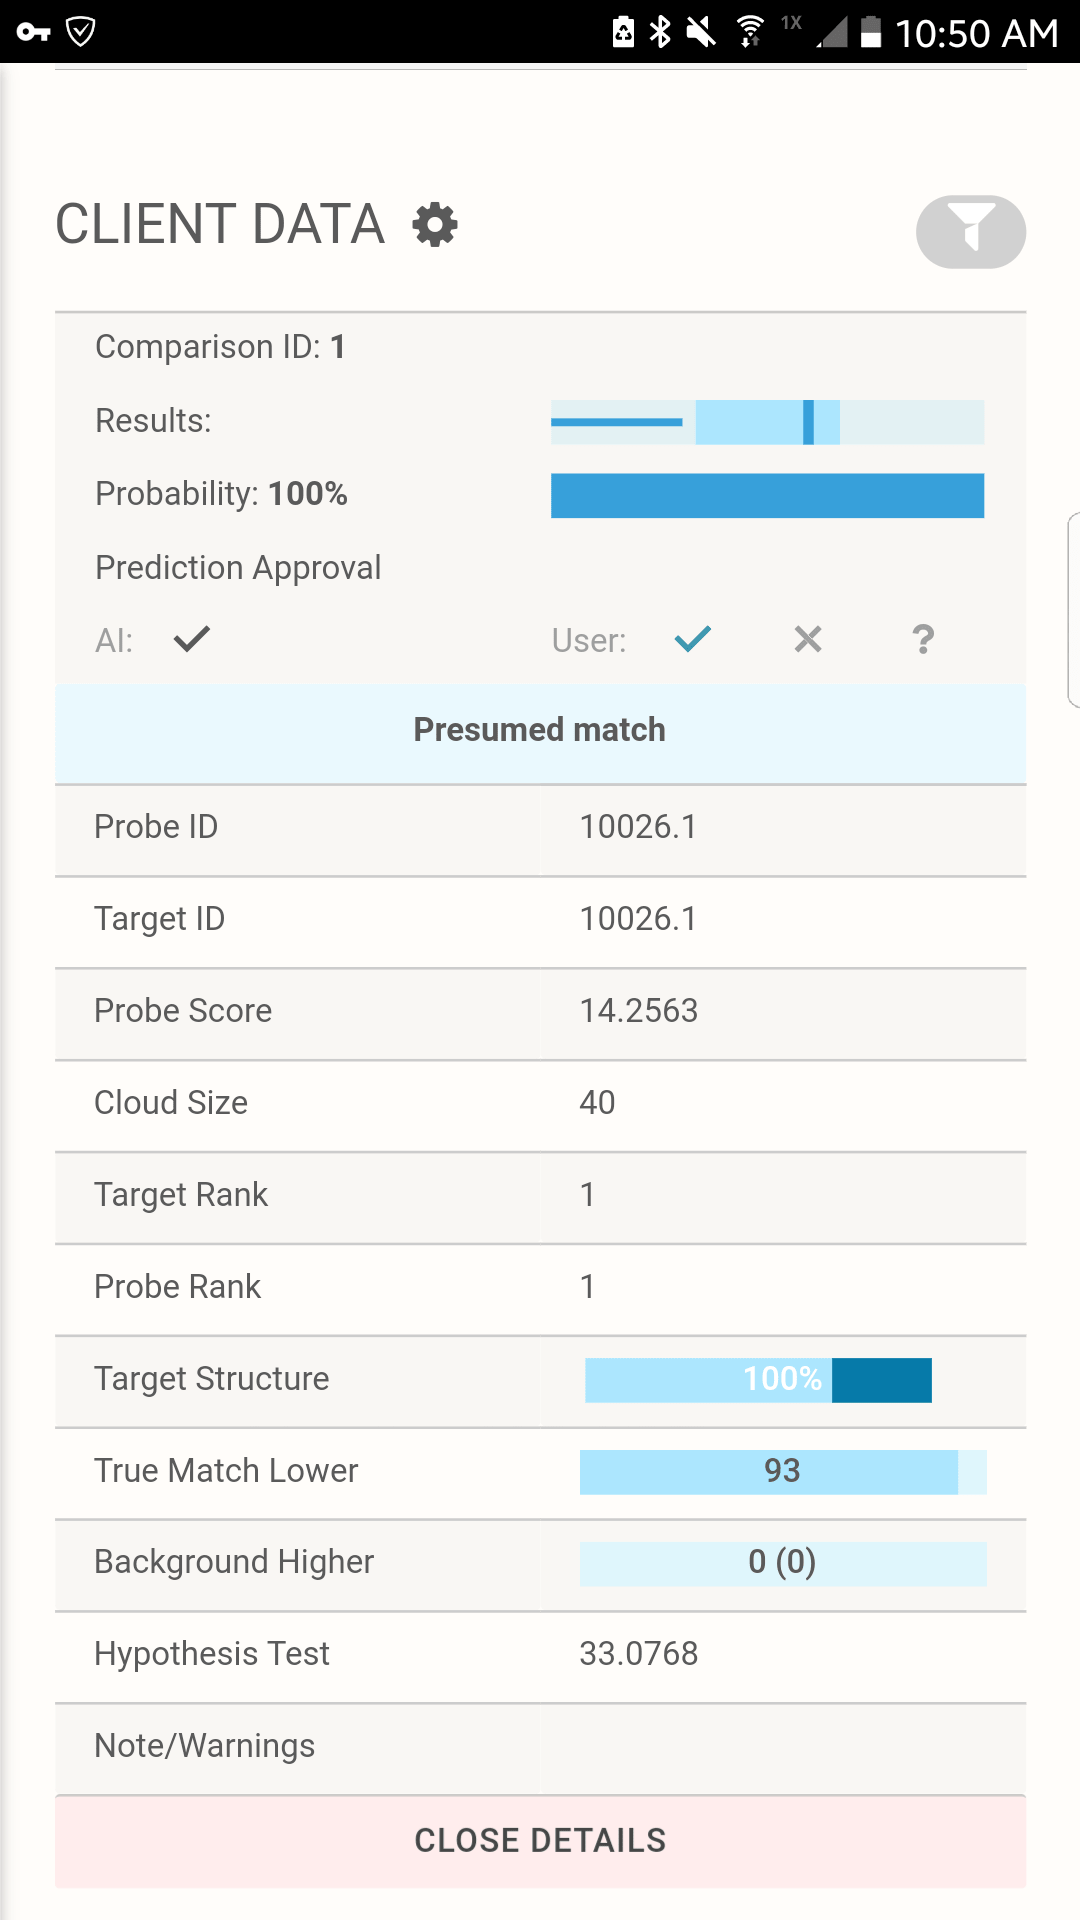
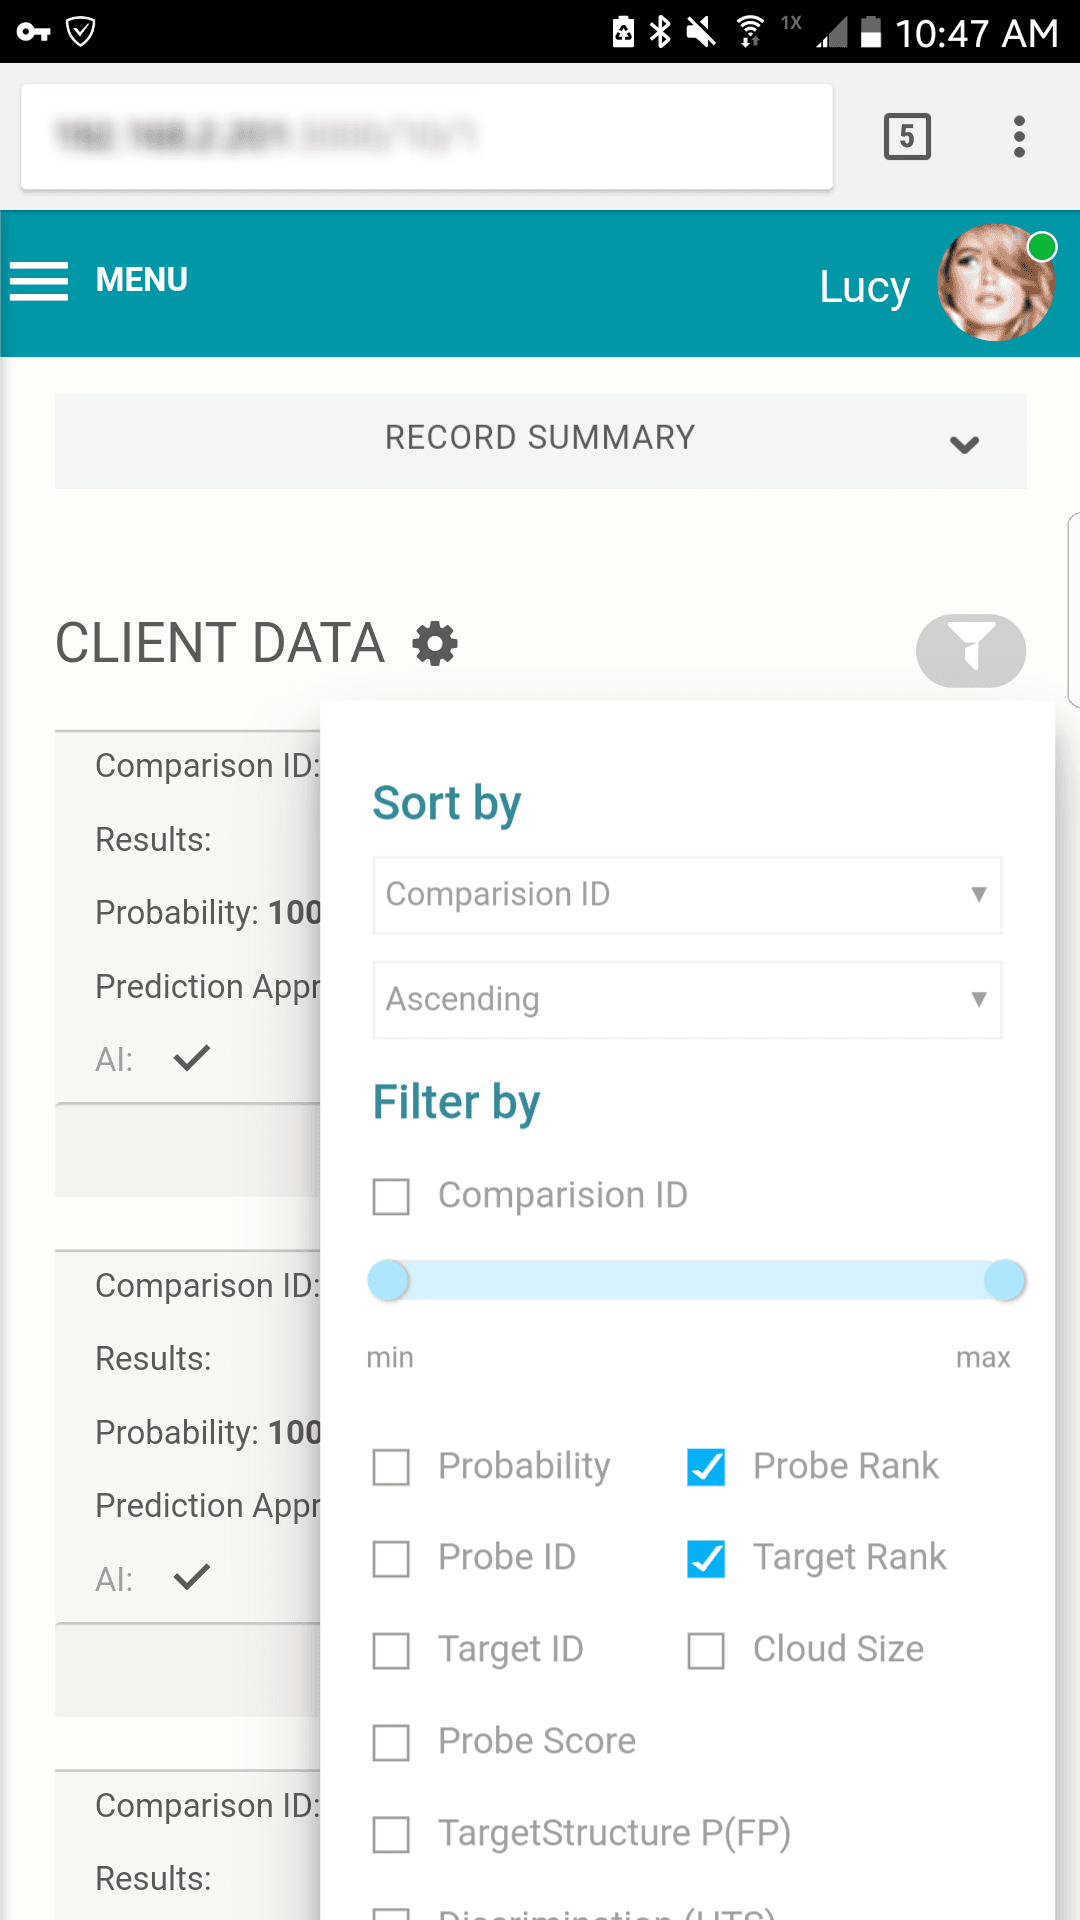
Full tabulation of results for Example Scenario 1. Taking a fresh look at the original scenario, the AI interface allows all three missing individuals in 1A, 1B, and 1C to be queried. In the case of the pedigree with rare alleles (1B indicated in the red box), the system identifies only one possible match.
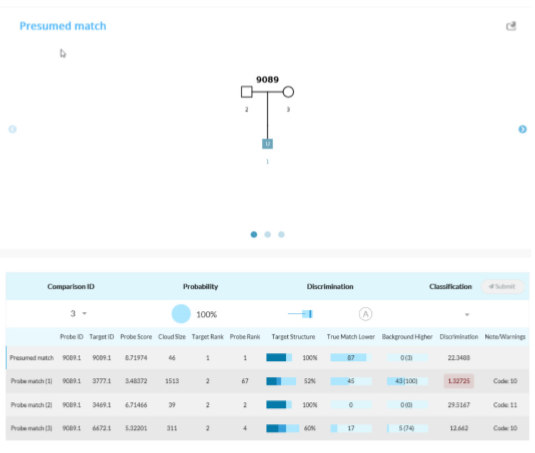
Tabulation of results after selecting the presumed match for Scenario 1C. The AI interface displays the pedigree and associated matches.
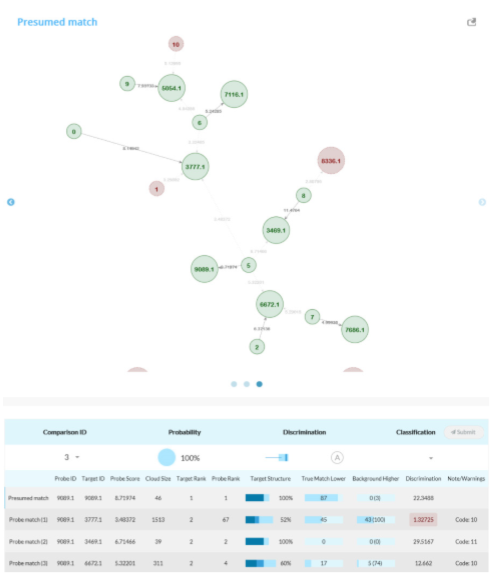
Network map for Example Scenario 1. Although the three pedigree structures were identical, they actually belong to independent networks.
This final example illustrates the full purpose of the AI: To objectively identify matches based on predictive accuracy. This ability is optimized from an information and technical perspective. From an information perspective, the AI leverages the discrimination ability of pedigree structures and genotypes, the racial background relevant for the analysis (allele frequency distribution), and a global analysis of all pedigree matches against the individuals in the database (and vice versa). From a technical perspective, the AI efficiently integrates new information and makes intelligent use of its resources leveraging current massively parallel computer architecture capabilities, whether they combine general-purpose computing on graphics processing units (GPGPU), multi-threaded and multicore processors on a local server cluster, or cloud services (e.g. Azure and AWS).